Home > All Applications > Imaging Cytometry
Imaging Cytometry Assay
Quantitative analysis of multicolor (multiplexed) labeled cells
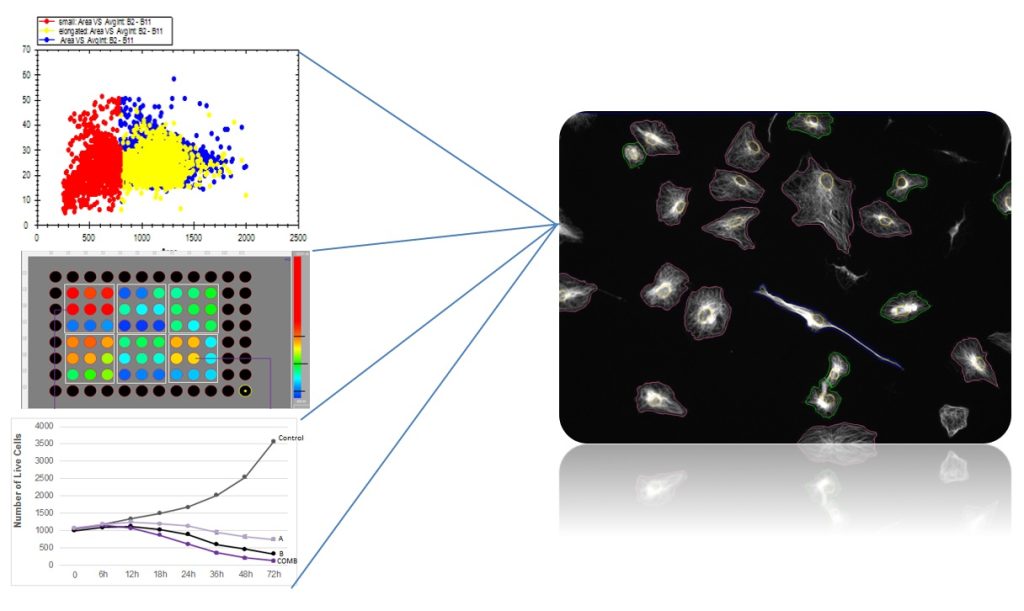
- Image-Based Cytometry, Sub-Population Identification & Multi-Parametric Analysis
Segregate a heterogeneous mixture of cells into a variety of sub-populations as in FACS (fluorescence-activated cell sorting). - Automated classification of color-based cellular sub-populations for each well of a micro-well plate
- Defining morphological features for each sub-population, including intracellular structures, using the high-resolution captured images
- Suitable for live cell imaging – possibility to follow and to return to the sample over time to study changes in each sub-population.
- Multiple visualization tools to present sub populations

Fluorescent in situ hybridization (FISH)
Quantitative cytometry and population tools applied to detect cells expressing XY chromosome combination.
Y Chromosome (red) X Chromosome (green) XY cells – mail (orange mask) Not XY cells – (blue mask)

RNA FISH
RNA FISH (20x magnification) in macrophages stimulated with innate immune agonists.
Nuclei were stained with DAPI (blue) while IL-10 (green) and TNFα (red) were stained by ViewRNA FISH.
Data courtesy of David Stirling and Matthew Solomons (Noursadeghi Lab, Division of Infection and Immunity, University College London)


Image Based Cytometry, Sub-Population Identification & Multi-Parametric Analysis
Segregate a heterogeneous mixture of cells into a variety of sub-populations as in FACS (fluorescence-activated cell sorting)
Automated classification of color-based cellular sub-populations for each well of a micro-well plate
Defining morphological features for each sub-population, including intracellular structures, using the high-resolution captured images
Suitable for live cell imaging – possibility to follow and to return to the sample over time to study changes in each sub-population.
Multiple visualization tools to present sub populations

Fluorescent in situ hybridization (FISH)
Quantitative cytometry and population tools applied to detect cells expressing XY chromosome combination.
Y Chromosome (red)
X Chromosome (green)
XY cells – mail (orange mask)
Not XY cells – (blue mask)

RNA FISH
RNA FISH (20x magnification) in macrophages stimulated with innate immune agonists.
Nuclei were stained with DAPI (blue) while IL-10 (green) and TNFα (red) were stained by ViewRNA FISH.
Data courtesy of David Stirling and Matthew Solomons (Noursadeghi Lab, Division of Infection and Immunity, University College London)
Live Zebrafish imaging at 10x magnification
Video capture from a live Zebrafish larva
With thanks to Dr Gillian Tomlinson from the UCL Division of Infection and Immunity, UCL, UK
Live Zebrafish imaging- Blood flow
Video capture from a live Zebrafish larva imaged in bright field illumination using 40X magnification. Acquired by Dr Gillian Tomlinson using IDEA Bio-Medical’s Hermes WiScan at the UCL Division of Infection and Immunity, London, UK.
Fish organs & regions automatic segmentation
Automatically quantify area, fluorescence intensity, and count of whole fish and internal organelle properties, including eye, yolk, spine, tail, brain, internal granules and more.Statistical data calculated per fish and per organelle.
Time lapse Zebrafish- Neutrophil Migration
Time lapse of a Zebrafish embryo with S. Pneumoniae injected into the hind brain. GFP-expressing Neutrophils begin to migrate into the injection site over 4 hours.Acquired with IDEA Bio-Medical’s Hermes automated screening system by Sreyashi Koyel Basu and Dr. Gillian Tomlinson, UCL, London, UK
