Home > All Applications > Mitochondria Analysis
Mitochondria Analysis Assays
Detection & quantification of Mitochondria and their cellular distribution
Mitochondria and other sub-cellular organelles can be detected and analyzed using fluorescence labelling.
WiSoft Athena‘s automatic and accurate segmentation enables acquiring data for each mitochondria.
Various features can be measured, based on fluorescence intensity and morphological features.
Option for time lapse imaging and analysis
- Mitochondrial dynamics studies
- Mitochondrial numbers and volume measurement
- Study related human diseases (e.g. Parkinson, Huntington’s disease)
- Live imaging of Mitochondria clusters
Time lapse imaging applied with Mito-tracker labelling to follow formation of mitochondria clusters in living cells
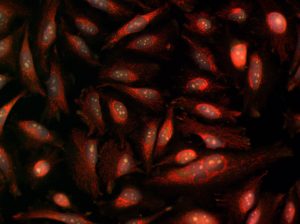
Mitochondria Morphology

Captured with 40X/0.75 magnification
Dyes:Red – TMRM (mitochondrial potential marker), green – MitoTracker (mitochondrial marker), blue – Hoechst
Analysis – morphological features were recorded for each mitochondria- length, area, intensity, etc
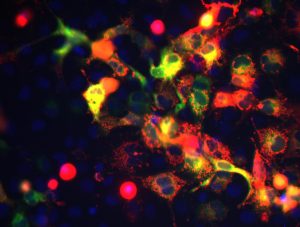
Mitochondrial Potential

Captured with 20X/0.75NA magnification
Dyes: Red – TMRM (mitochondrial potential marker), green – MitoTracker (mitochondrial marker), blue – Hoechst
Analysis – Potential intensitymarker intensity (red/green intensity ratio)


Mitochondria and other sub-cellular organelles can be detected and analysed using fluorescence labelling.
WiSoft Athena‘s automatic and accurate segmentation enables acquiring data for each mitochondria.
Various features can be measured, based on fluorescence intensity and morphological features.
Option for time lapse imaging and analysis
- Mitochondrial dynamics studies
- Mitochondrial numbers and volume measurement
- Study related human diseases (e.g. Parkinson, Huntington’s disease)
- Live imaging of Mitochondria clusters
Time lapse imaging applied with Mito-tracker labelling to follow formation of mitochondria clusters in living cells

Mitochondria Morphology
Captured with 40X/0.75 magnification
Dyes:Red – TMRM (mitochondrial potential marker), green – MitoTracker (mitochondrial marker), blue – Hoechst
Analysis – morphological features were recorded for each mitochondria- length, area, intensity, etc

Mitochondrial Potential
Captured with 20X/0.75NA magnification
Dyes: Red – TMRM (mitochondrial potential marker), green – MitoTracker (mitochondrial marker), blue – Hoechst
Analysis – Potential intensitymarker intensity (red/green intensity ratio)
Live Zebrafish imaging at 10x magnification
Video capture from a live Zebrafish larva
With thanks to Dr Gillian Tomlinson from the UCL Division of Infection and Immunity, UCL, UK
Live Zebrafish imaging- Blood flow
Video capture from a live Zebrafish larva imaged in bright field illumination using 40X magnification. Acquired by Dr Gillian Tomlinson using IDEA Bio-Medical’s Hermes WiScan at the UCL Division of Infection and Immunity, London, UK.
Fish organs & regions automatic segmentation
Automatically quantify area, fluorescence intensity, and count of whole fish and internal organelle properties, including eye, yolk, spine, tail, brain, internal granules and more.Statistical data calculated per fish and per organelle.
Time lapse Zebrafish- Neutrophil Migration
Time lapse of a Zebrafish embryo with S. Pneumoniae injected into the hind brain. GFP-expressing Neutrophils begin to migrate into the injection site over 4 hours.Acquired with IDEA Bio-Medical’s Hermes automated screening system by Sreyashi Koyel Basu and Dr. Gillian Tomlinson, UCL, London, UK
